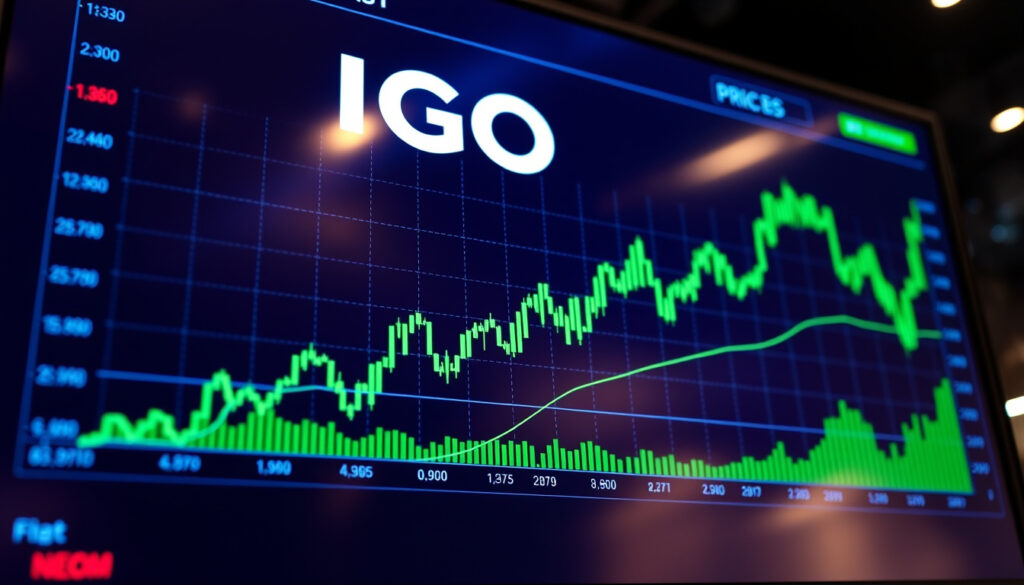
Igo Share Price – Live Data, Charts and Forecast
IGO Limited trades on the Australian Securities Exchange under the ticker ASX:IGO, positioning itself as a significant player in the critical minerals sector. The company operates nickel, copper, and cobalt mines while maintaining a 49% joint venture stake in lithium mining and processing operations, aligning its business with global demand for electric vehicle battery materials.
Investors tracking ASX:IGO have witnessed considerable volatility, with the stock experiencing significant swings over recent years. The minerals exploration and processing company commands a market capitalisation of 3.87 billion AUD, making it a notable mid-cap constituent within Australia’s mining landscape. Understanding IGO’s share price movements requires examining both commodity market dynamics and company-specific operational factors.
This comprehensive overview provides current pricing data, historical context, analyst perspectives, and practical information for those monitoring or considering investment in IGO Limited. The information presented draws from exchange data, financial platforms, and market analysis to offer a balanced snapshot of where the stock stands and what factors may influence its trajectory.
## What is the Current IGO Share Price?
As of the most recent available data, IGO Limited shares trade at 8.15 AUD, representing a modest gain of 0.12% over the preceding 24-hour period. The market capitalisation stands at approximately 3.87 billion AUD, reflecting the company’s substantial presence in the Australian critical minerals sector. Market participants should note that share prices fluctuate continuously during trading sessions, and quotes may vary across different data platforms due to timestamp differences.
### Key Performance Metrics
- The stock demonstrates high volatility at 3.69%, significantly exceeding broader market averages and indicating pronounced price sensitivity to sector and commodity developments.
- With a beta coefficient of 1.94, IGO shares tend to amplify broader market movements, presenting higher risk-reward characteristics for investors.
- The company reported negative basic earnings per share (TTM) of -1.26 AUD, reflecting challenging conditions across its operational portfolio.
- Recent fiscal year results show net income of -954.60 million AUD against revenue of 499.90 million AUD, highlighting the impact of commodity price volatility on profitability.
- Director trading activity has been observed, with board members executing transactions at various price points reflecting confidence or portfolio rebalancing decisions.
- Volatility metrics and beta readings suggest investors should anticipate price swings when monitoring positions in this counter.
### IGO Stock Snapshot
| Metric | Value |
|---|---|
| Current Price | 8.15 AUD |
| Market Capitalisation | 3.87 billion AUD |
| 52-Week High | 17.32 AUD |
| 52-Week Low | 0.17 AUD (all-time low) |
| Beta Coefficient | 1.94 |
| Basic EPS (TTM) | -1.26 AUD |
| Revenue (FY) | 499.90 million AUD |
| Dividend Yield | Not specified in available data |
| Sector | Mining (Nickel, Copper, Cobalt, Lithium) |
| Exchange | ASX |
For real-time price tracking and interactive charting, investors frequently utilise platforms such as TradingView and Market Index, which offer multiple timeframe views and technical analysis tools. Live data is also available directly through the ASX company page and IGO’s investor centre.
## What is IGO Share Price History and Performance?
### Historical Price Milestones
IGO Limited has experienced a dramatic price journey since its earlier trading history. The stock achieved its all-time high of 17.32 AUD on November 11, 2022, coinciding with peak demand expectations for battery minerals amid the global electric vehicle expansion narrative. Conversely, the all-time low of 0.17 AUD was recorded on January 17, 2002, illustrating the considerable distance the company and its shareholders have travelled over two decades of operation.
Year-end closing prices demonstrate the volatility inherent in mining sector investments. The 2022 close of 9.94 AUD reflected market optimism surrounding critical minerals, while 2023 saw the stock retreat to 15.20 AUD before declining sharply to 5.64 AUD by the end of 2024. Earlier historical closes ranged between 3.15 AUD and 7.63 AUD across preceding years, indicating periods of both consolidation and advancement.
The 52-week range spanning from near-historical lows to substantial recovery levels reflects the cyclical nature of commodity markets. Nickel, copper, and lithium prices fluctuate based on global demand patterns, supply disruptions, and EV adoption rates—all factors that directly influence IGO’s operational profitability and market valuation.
### Recent Performance Assessment
Looking at more recent trading periods, the stock has underperformed relative to both its sector peers and the broader ASX 200 index. Over a one-year timeframe, IGO shares declined 14.00% compared to sector performance and lagged the ASX 200 by 22.58%, indicating meaningful underperformance that warrants examination of underlying drivers.
Alternative price points captured during data collection illustrate the range of quoted values investors may encounter. Recent trades at 5.09 AUD showed daily decline of 0.39% with weekly gains of 8.49% but monthly losses of 3.58% and annual decline of 9.75%. Another snapshot recorded 5.35 AUD with a daily decrease of 5.64%, demonstrating the rapid intra-day swings characteristic of this counter.
### Drivers Behind Recent Price Movements
Several factors have contributed to the share price trajectory observed over recent periods. Commodity price fluctuations for nickel, copper, and cobalt directly impact revenue projections and investor sentiment toward mining companies. Additionally, lithium market dynamics—given IGO’s 49% joint venture interest in lithium operations—introduce both opportunity and uncertainty to the investment thesis.
Operational developments at the Nova and Forrestania Nickel Operations, alongside the Cosmos Nickel Project, serve as company-specific catalysts that can move the share price independent of broader market conditions. Production announcements, exploration results, and cost management initiatives all feature in investor analysis of the counter.
## What is the IGO Share Price Forecast?
### Analyst Price Targets and Expectations
Professional analysts covering ASX:IGO have established a consensus price target range spanning 3.60 AUD to 6.60 AUD according to available consensus data. This range sits below current trading levels, suggesting caution among the analyst community regarding near-term upside potential. Investors should interpret these targets as one input among many when forming their own outlook.
Independent forecasting platforms offer additional perspective on potential price direction. Trading Economics projects a target of 5.70 AUD within the near-term quarterly timeframe, with a one-year forecast of 5.36 AUD. These projections incorporate broader economic conditions, sector dynamics, and historical valuation metrics, though forecasts inherently carry uncertainty especially in volatile commodity markets.
It is important to recognise that analyst projections and price forecasts reflect estimates based on available information and are not guarantees of future performance. Commodity price volatility, operational developments, and macroeconomic shifts can cause actual outcomes to diverge materially from consensus expectations. Investors should conduct their own due diligence and consider multiple information sources when evaluating investment decisions.
### Earnings Outlook and Financial Projections
Looking ahead to financial performance, analysts estimate H1 2026 earnings at -0.05 AUD per share on projected revenue of 214.04 million AUD, with the next major earnings release anticipated around February 4, 2026. These forward estimates suggest continued pressure on profitability in the near term, though loss-making periods in mining companies often reflect investment phases, write-downs, or commodity price cycles rather than fundamental business deterioration.
Recent earnings history provides context for these projections. The most recently reported H1 result showed earnings per share of -0.23 AUD against consensus expectations of -0.06 AUD, representing a significant negative surprise of -288.95%. Such variances underscore the challenges investors face in predicting outcomes for companies with exposure to fluctuating commodity prices.
### Investment Considerations
For those evaluating whether IGO represents a buy, sell, or hold opportunity, several factors merit consideration. The high beta reading of 1.94 indicates the stock tends to experience amplified movements relative to broader market indices, which may suit investors with higher risk tolerance seeking exposure to critical minerals but could disappoint those preferring stability.
Technical indicators and buy/sell signals are not explicitly articulated in available analyst coverage. Investors interested in such signals may wish to monitor volatility metrics, beta trends, and analyst target ranges through platforms like TradingView, which offers charting tools and technical analysis capabilities. Fundamental analysis should complement any technical signals when making investment decisions.
## What is IGO Dividend Yield and Company Overview?
### Dividend Information
Available data sources do not specify a dividend yield for IGO Limited shares. This absence typically indicates either that the company does not currently pay dividends or that the information has not been disclosed in the datasets examined. Mining companies frequently reinvest profits into exploration and development activities rather than distributing cash to shareholders, particularly during periods of capital investment or commodity price uncertainty.
Investors seeking dividend income from ASX-listed mining companies may wish to research other constituents of the sector. Those interested in IGO for growth potential should monitor company announcements and annual reports for any future dividend policy announcements or changes to capital return frameworks.
### Company Business Overview
IGO Limited operates as a mineral exploration and processing company with primary operations spanning nickel, copper, and cobalt mining and processing activities. The company’s core asset portfolio includes the Nova Nickel Operation and Forrestania Nickel Operations in Western Australia, along with the Cosmos Nickel Project. These assets position IGO within the critical minerals supply chain serving battery and electrification markets.
A significant component of IGO’s business involves a 49% joint venture interest in both upstream and downstream lithium mining and processing operations. This exposure connects the company to the electric vehicle supply chain and renewable energy storage markets, which continue attracting investment and policy attention globally.
### Acquiring IGO Shares
Investors wishing to purchase IGO shares can do so through any ASX-licensed broker or trading platform. Prospective buyers should compare brokerage fees, platform features, and research offerings when selecting a provider. The stock trades under ticker code IGO on the Australian Securities Exchange, and international investors may access it through global depositary receipts or brokers offering international market access to ASX-listed securities.
Understanding the company’s operations and strategic direction supports informed investment decisions. For broader context on Australian market options, readers may find value in reviewing coverage of Harvey Norman Marion as an example of ASX company analysis, or exploring Best Phone Plans Australia resources for additional consumer and market perspectives.
## Key Events in IGO Share Price History
- — IGO Limited records its all-time low closing price of 0.17 AUD during early trading history.
- — The stock achieves its all-time high of 17.32 AUD amid peak battery metals optimism and EV market enthusiasm.
- — Year-end close at 9.94 AUD reflects market correction from highs while maintaining significant gains from historical levels.
- — Stock closes at 15.20 AUD, representing a substantial recovery from the previous year despite sector challenges.
- — Director Ivan Vella issued 609,926 shares at 5.06 AUD as part of equity compensation arrangements.
- — Year-end close at 5.64 AUD marks significant annual decline reflecting sector headwinds and commodity price pressures.
- — Director Samantha Hogg purchases 20,000 shares at 3.90 AUD, representing director confidence or portfolio rebalancing activity.
For comprehensive announcement tracking and operational updates, investors can monitor IGO’s investor relations portal and ASX company announcements which provide regulatory filings, financial reports, and material market updates.
## What Information is Certain Versus Uncertain?
Established Information
- Current trading price approximately 8.15 AUD with 3.87 billion AUD market capitalisation
- All-time high of 17.32 AUD recorded November 11, 2022
- All-time low of 0.17 AUD recorded January 17, 2002
- Historical year-end closes for 2022 through 2024
- Negative EPS and financial results for recent periods
- 49% joint venture interest in lithium operations
- Core mining operations in nickel, copper, and cobalt
- Trading on ASX under ticker code IGO
- High volatility metrics and beta of 1.94
Information That Remains Unclear
- Whether dividend payments are expected or planned for future periods
- Precise reasons for recent price decline versus sector benchmarks
- Specific lithium market impact on current valuations
- Whether current prices represent fair value relative to fundamentals
- Exact timing and magnitude of future commodity price recovery
- Clear buy or sell signals based on technical analysis
- Impact of upcoming project developments on financial performance
- 2025 year-to-date performance data
Price data may show inconsistencies across different platforms and data providers due to timestamp variations and market update frequencies. Investors should prioritise recent data from primary exchange sources such as ASX or established financial data providers when making time-sensitive decisions. Cross-referencing multiple sources helps ensure accuracy and reduces reliance on potentially outdated information.
## Understanding IGO’s Position in the Mining Sector
IGO Limited occupies a defined position within Australia’s diversified mining landscape, operating assets that contribute to the global critical minerals supply chain. The company’s focus on nickel, copper, and cobalt aligns with industrial applications spanning stainless steel production, electrical infrastructure, and battery manufacturing. The lithium joint venture extends this exposure into the rapidly expanding electric vehicle and energy storage markets.
Australia’s mining sector more broadly benefits from established infrastructure, geological endowment, and regulatory frameworks that support exploration and production activities. Companies like IGO operate within this ecosystem, subject to commodity price cycles, operational risks, and global demand patterns that influence investor sentiment and valuation metrics across the sector.
Understanding the company’s business model and market position provides context for interpreting share price movements and evaluating investment merit. The intersection of commodity markets, technological change, and energy transition themes creates both opportunities and uncertainties that investors must navigate when considering exposure to critical minerals companies.
## Sources and Market Data
Primary market data and share price information referenced in this overview draws from multiple established financial data sources. Real-time and near-real-time pricing originates from TradingView, which aggregates data from Australian exchange feeds and provides interactive charting capabilities across multiple timeframes. Market Index offers Australian-market-specific context and historical price data tailored to ASX-listed securities.
IGO Limited is a mineral exploration company focused on nickel, copper, cobalt mining and processing at Nova and Forrestania Nickel Operations, the Cosmos Nickel Project, and a 49% joint venture in upstream and downstream lithium mining and processing.
— Company description, Market Index
Additional financial metrics and projections derive from Trading Economics, which offers econometric forecasting based on historical patterns and market consensus. The company’s own investor relations materials and ASX regulatory filings provide authoritative primary sources for corporate announcements and official disclosures. Financial data showing net income of -782.1 million AUD and operating profit of -249.4 million AUD reflects recent fiscal period results as tracked through aggregate financial platforms.
For authoritative and current information, investors should consult official exchange announcements, company annual reports, and verified financial data providers. The sources referenced throughout this article represent established industry platforms but should not substitute for independent research and verification when making investment decisions.
## Summary: Key Takeaways on IGO Share Price
IGO Limited shares trade at approximately 8.15 AUD with a market capitalisation of 3.87 billion AUD, reflecting the company’s significant but volatile position within Australia’s critical minerals sector. The stock has experienced substantial declines over recent periods, underperforming both sector benchmarks and the broader ASX 200 index. Historical data reveals considerable range between all-time highs of 17.32 AUD and the current trading level, illustrating the cyclical nature of mining investments.
Analyst projections suggest potential for further downside, with consensus targets ranging from 3.60 AUD to 6.60 AUD, though forecasts inherently carry uncertainty particularly given commodity market volatility. The company’s 49% lithium joint venture provides exposure to growth themes within the electric vehicle supply chain, while core operations in nickel, copper, and cobalt anchor its business to established industrial applications. For those researching Australian market options, additional context on ASX-listed companies and market dynamics can be found through Harvey Norman Marion and Best Phone Plans Australia resources.
Investors monitoring ASX:IGO should track official exchange announcements, verify pricing data against primary sources, and consider the high beta and volatility characteristics when assessing risk parameters. The absence of specified dividend yield indicates a growth-oriented investment profile rather than income generation, appropriate for investors with longer time horizons and higher risk tolerance seeking exposure to critical minerals and energy transition themes.
## Frequently Asked Questions
Is IGO a good stock to buy?
Whether IGO represents a good purchase depends on individual investment objectives, risk tolerance, and conviction in the company’s long-term prospects. The stock’s high volatility and beta suggest pronounced price swings, while analyst targets indicate caution regarding near-term upside. Investors should conduct thorough research and consider commodity market conditions before deciding.
How can I buy IGO shares?
IGO shares can be purchased through any broker or trading platform with access to the Australian Securities Exchange. The stock trades under ticker code IGO. International investors may access ASX-listed securities through brokers offering international market access or global depositary receipt programs.
What does IGO Limited actually do?
IGO operates nickel, copper, and cobalt mines and processing facilities in Western Australia, including the Nova Nickel Operation, Forrestania Nickel Operations, and Cosmos Nickel Project. The company also holds a 49% joint venture interest in lithium mining and processing, connecting it to electric vehicle battery supply chains.
What is IGO’s dividend yield?
Available data does not specify a dividend yield for IGO Limited. The absence of this information typically indicates the company does not currently pay dividends, common among mining companies during capital-intensive growth phases or periods of commodity price weakness.
Why has IGO share price declined recently?
The stock has underperformed relative to sector and market benchmarks over recent periods. Multiple factors likely contribute, including commodity price volatility for nickel, copper, and cobalt; lithium market uncertainty; and broader market rotation away from growth and speculative positions. Specific causal factors require examination of operational and market data.
What is IGO’s 52-week trading range?
Available data shows an all-time high of 17.32 AUD (November 2022) and all-time low of 0.17 AUD (January 2002). Recent year-end closes include 15.20 AUD (2023) and 5.64 AUD (2024), with the current price around 8.15 AUD reflecting ongoing volatility.
Where can I find live IGO share price data?
Live and interactive price data is available through TradingView, Market Index, the official ASX company page, and IGO’s own investor centre. These platforms offer real-time quotes, historical charts, and analytical tools suitable for monitoring the stock.
More related posts
 Yellow Deli Katoomba: Menu, Reviews, and Cult Controversy
 Shane Warne’s Death: Official Cause, Drugs, and Funeral
 Queensland Public Holidays 2026, 2027 | Dates & List
 Sam Reid: Biography, Relationships, Singing and French
 Sarah Silverman: Relationships, SNL Firing, and Career Facts
 Mark Twain: Biography, Tragedies & Controversial Views
 Travis Kelce & Taylor Swift: Relationship Timeline & Facts
 Dyson Air Straight – Review, Price and Verdict